The first known chart of the Gulf Stream was the work of Benjamin Franklin (1706-1788) in 1769, for which the American scientist sought out sailors taking advantage of it on their crossings from North America to Europe. He therefore represented the Gulf Stream as a kind of straight and continuous ocean river. It wasn’t until the 20th century that scientists discovered marine currents in fact generate turbulent eddies in their wake. Many years later, largely thanks to space technologies, oceanographers realized that such eddies—more pronounced and numerous in major currents—are all over the world’s oceans.
Far from being just an ocean curiosity, eddies are instrumental in the mixing of surface and deep waters. As a result of the significant exchanges of heat between the ocean and atmosphere, they transport heat from the surface to the ocean depths, thus playing a key role in regulating Earth’s climate. And by mixing dissolved CO2 and nutrients, eddies structure the environment of marine animals, which rely on them to feed, stay warm and move around.
Since the early 1990s, altimetry satellites like TOPEX/Poseidon, Jason 1, 2 and 3 or Sentinel-6 Michael Freilich, alongside their radar counterparts ERS, Envisat, Sentinel-3, CryoSat, SARAL and HY, have revealed hundreds of thousands of eddies. Persisting for anything from a few weeks to more than a year, they show up in sea surface height data as peaks and troughs of up to one metre, which correspond to more or less warm zones in the surrounding ocean. However, even by combining measurements from ten different satellites, it’s still not possible to see eddies spanning less than 100 kilometres. For that, other spaceborne or buoy-borne technologies—notably on buoys located by satellite—have shown that smaller eddies exist.
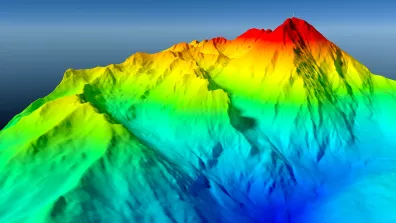
Thanks to its high resolution and the wide swath of its main KaRIn instrument, the SWOT mission developed by CNES and NASA’s Jet Propulsion Laboratory (JPL) is able to detect eddies ten times smaller than anything seen by previous satellite altimetry missions.

In the image above, acquired in the Gulf Stream off the coast of the United States, SWOT reveals two eddies—in red at the top and blue at the bottom—each spanning 30 to 50 kilometres. Between them, we see several eddies no larger than a few kilometres across: such data acquired in a single satellite pass are unprecedented.
This new vision of the oceans should help us to gain new insights into the role of small eddies in shaping climate, as well as how they are interlinked and their relationship with ocean currents. It brings a new dimension to ocean research and the creation of favourable environments for marine life.
Oceanography data from the SWOT mission can be accessed via the AVISO platform and hydrology data at hydroweb.next.
-

-
Newsletter
Earth here! Subscribe to the newsletter and discover the latest news analyzed by CNES 🌍