Several space missions, including the most recent one CO3D, play a key role in understanding our Earth in three dimensions. At CNES, teams are developing algorithms capable of exploiting the data transmitted by these satellites to obtain 3D images. Explanations in this article from the Data Campus.
3D Earth observation from satellite
For several decades, space missions have played a key role in understanding our planet in 3D. Technological advances have improved the resolution of images, the frequency of revisits, and the diversity of observation methods: optical, radar (SAR), interferometry, LiDAR, etc. Among the optical satellites, we can mention the SPOT, WorldView, Pléiades, Pléiades NEO constellations, and more recently, CO3D. Regarding radars (SAR and I-SAR), missions like ICEYE and ICESat-2 stand out, while for LiDAR, ICESat and GEDI are references.

CNES is responsible for developing algorithms capable of exploiting all this data and making the best use of it, particularly in optics. 3D reconstruction from optical images mainly relies on the use of one or more pairs of stereoscopic images, i.e., two images of the same place taken from different angles. Several methods enable the acquisition of these images, as detailed below.
Using agile satellites
The first method consists in using a satellite capable of quickly changing its viewing angle. It takes a first image, then moves slightly to capture a second one from another angle (see illustration below).

Among the optical satellites, the Pléiades and Pléiades NEO satellites are agile and therefore capable of acquiring images in stereoscopic (stereo) mode. It is also possible to acquire images in "tri-stereo" mode, i.e., three images from three different viewpoints. Tri-stereo images, with one acquired near the vertical, are particularly useful in dense cities or mountain regions when buildings or reliefs can obstruct the satellite's view of the area.

However, this technique has a disadvantage: a small temporal gap between the acquisitions. Thus, moving objects (cars, trains, vegetation in the presence of wind, etc.) can change position between the images, complicating their 3D restitution.
Using satellite constellations
To address this problem, a second method consists in using several satellites that take images simultaneously from different angles. Unlike the previous method, all images are acquired at the same instant, thus eliminating the effects of movement of objects within the scene.

The CO3D constellation allows observing the ground simultaneously by two satellites from different angles. This type of image acquisition is known as stereo-synchronous pairing.

But how to produce a 3D model from these stereoscopic images, whether synchronous or not?
Classical photogrammetry: principles and applications
Principle
Just as our eyes perceive depth through the angle difference between our two pupils, satellites use the same principle to reconstruct 3D models. This technique is based on measuring the pixel displacement between two images taken from different angles. When a satellite takes a photo of a point on the ground, this point appears at a different position on the image depending on the viewing angle. This position difference, called parallax, gives us information about the point's altitude.
This creates an interesting effect:
- The higher an object's altitude, the larger the parallax (like when you look at an object close to your eyes, such as the spoon in the image below).
- The lower an object's altitude, the smaller the parallax (like when you look at a distant object, such as the bottle in the image below).
 et un objet éloigné (bouteille)")
LThe angle difference between two satellites is expressed by the B/H ratio:
- B (Base): distance between the two satellites.
- H (Height): altitude of the satellites relative to the ground.
When the B/H ratio is low (i.e., the distance between the satellites is small compared to their altitude), the measured parallax between the two images is low. This can lead to a decrease in altimetric precision. Conversely, the higher the B/H ratio, the greater the measured parallax between the two images—resulting in better altimetric precision. However, in urban areas, urban canyons, for example, may not be visible on both images simultaneously (we talk about occulsions), making it impossible to measure their parallax. Therefore, a compromise must be found for the B/H ratio.

The apparent displacement of a point between the two images allows determining its altitude by triangulation, as illustrated below:
To perform this triangulation, it is essential to know the exact position of the satellites (S1 and S2 in the image above) at the time of the acquisition. Geometric models will provide this information.
CARS photogrammetry software for DSM production
CARS is an open source software developed by CNES that allows producing a Digital Surface Model (DSM) from one or more stereoscopic pairs. Its use is relatively easy since CARS can be launched via a command line by indicating only the stereoscopic image pair(s) via a configuration file. The images can come from Pléiades, Worldview, or any optical satellite allowing stereo acquisitions.
A DSM (Digital Surface Model) is a 2.5D representation of the Earth's surface, where each point in an image (x,y) is associated with an altitude (z).

The CARS software relies on four main steps: resampling, matching, triangulation, and rasterization, that we will explain hereafter.
Resampling
The goal of this step is to resample the images to put them in "epipolar" geometry. In epipolar geometry, the pixels of the same object lie along the same line when the viewing angle changes. For example, in the image below, the top of the pyramid is on the same line. This type of transformation simplifies the matching process (step 2) as it reduces the search for corresponding pixels to a single dimension. This improves computational performance and limits matching errors.

Matching
This step aims to identify, for each point in one image, its corresponding point in the second image. With the images in epipolar geometry, the search is constrained to a single line. The Pandora software, developed at CNES, executes this process. At the end of this step, a displacement map (or disparity map) is generated. Colored pixels in this map indicate successful matches, while transparent pixels highlight areas where matching failed, typically due to motion, shadows, or insufficient texture.

Triangulation
The goal of this step is to convert the displacements into 3D positions by intersecting the lines of sight of the two images, which allows obtaining the spatial coordinates (X,Y,Z) of the observed points. The result is a 3D point cloud (x,y,z).
 obtenu après l'étape de triangulation")
Rasterization
Rasterization is the final step of the process. It consists of projecting each 3D point (x,y,z) obtained onto a 2D grid to create a matrix image. This projection associates an altitude with each pixel of the grid, thus producing the final DSM.

Examples of DSM production with CARS
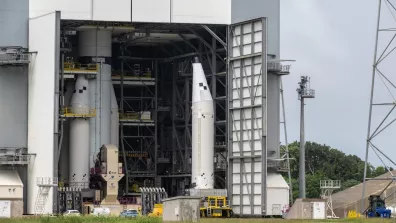
On July 25, 2025, the four satellites of the CO3D mission ("Constellation Optique en 3D") were successfully launched from the Guiana Space Center aboard the Vega-C launcher. The first data, currently being calibrated, already show very encouraging results. The image below shows a DSM from CO3D data, with a spatial resolution of 2 meters (CO3D's resolution will be 1m) on the Pic du Midi in the Pyrenees in France:

Bulldozer software : from DSM to DTM
In addition to the DSM, a Digital Terrain Model (DTM) can also be generated. This model represents the ground surface by removing above-ground elements such as buildings or vegetation from the Digital Surface Model.
This results in a pure topography representation of the scene, which proves particularly valuable for geomorphological studies like erosion monitoring or hydrological applications for identifying flood-prone areas.
The DTM enables derivation of the Digital Height Model (DHM), which illustrates the difference between DSM and DTM. This model finds application in urban modeling to accurately determine building and tree heights for creating precise digital twins.

To extract the DTM from a DSM obtaines with CARS, CNES developed the open-source tool Bulldozer. Unlike many DTM extraction methods, Bulldozer doesn't require any surface map or other exogenous data, like water masks. The tool operates on the principle of cloth simulation.
The process works as follows: the input DSM is first "cleaned" by filtering noisy areas, then inverted. A virtual cloth is dropped onto this inverted surface with tension applied to prevent it from sinking into the DSM's hollows. After several iterations, the resulting cloth accurately models the ground surface. Inverting this cloth yields the final DTM.
 calculé avec Bulldozer")

xDEM Software: 3D Model analysis
xDEM is an open source software that allows analyzing any type of Digital Elevation Model (DEM), including DSMs from CARS and DTMs from Bulldozer. Created by a collective of glaciology researchers (GlacioHack), it is now developed in collaboration with CNES teams. Its main functionalities include DEM co-registration, terrain attribute calculation (slope, shadow, aspect, curvature, roughness), as well as uncertainty analysis and bias corrections.
What is DEM co-registration for? Co-registration is a technique for aligning and superimposing several DEMs with precision to make them consistent with each other. It is sometimes necessary to align them, especially when they come from different sources. For example, a DSM calculated by CARS from Pléiades data and a LiDAR HD DSM derived from the LiDAR HD point cloud may have a slight offset that needs to be corrected to perform various analyses.

This is therefore an ideal tool for studying DEM changes from different dates and, in particular, the study of glacier melting. Within CNES, this tool is used, among other things, to qualify 3D products, for example by comparing a DSM from satellite images with a high-resolution LiDAR DSM (said to be reference).
Below is an altitude variation map produced by xDEM (in meters) between 1990 and 2009 in the Longyearbyen area (Svalbard, Norway). The black contours delimit the glaciers. The color palette shows elevation changes: red tones indicate a decrease in altitude, particularly marked on the glaciers.

Applications
3D change detection
One possible application of 3D spatial data is change detection, which involves comparing digital models generated at different dates to observe their differences. These change maps have various applications (such as urban development monitoring), but the focus here is on change detection following natural disasters. Rapid damage mapping is crucial for authorities and emergency services after major disasters.
Space imagery plays a vital role in crisis management, particularly through the International Charter Space and Major Disasters. It enables the acquisition of disaster images within hours of the event to locate and quantify damage. Traditionally, these damage maps were created manually by annotators analyzing the images.
Efforts are increasingly being made to automate parts of this process, allowing annotators to focus on validation or minor corrections. 3D change detection enhances 2D change detection, particularly for identifying destroyed buildings. A common 2D approach involves detecting buildings before and after a disaster, then removing from the pre-event map those still visible in post-event images. This produces a map of buildings present before the event that have disappeared.
However, when only partial building damage occurs (such as destroyed floors), these changes may go undetected in 2D analysis as the structure remains identifiable. 3D change detection can identify such impacted buildings and include them in damage assessments. Research conducted at CNES, through development of the open-source tool PICANTEO, has demonstrated the added value of 3D change detection alongside 2D methods, as shown in an area affected by the February 2023 earthquake in Kahramanmaraş.

Conclusion
3D reconstruction techniques have seen significant advances, moving from traditional photogrammetry methods to innovative approaches based on artificial intelligence. Photogrammetry, using stereoscopic images captured by agile satellites or constellations, allows creating precise Digital Surface Models (DSMs). These models are essential for various applications, such as change detection after a natural disaster, urban modeling, and glacier studies. Open-source software like CARS, Bulldozer, and xDEM facilitate the production, analysis, and comparison of these models, offering robust solutions for using 3D in practical contexts.
These advances improve our understanding and modeling of the environment, representing a significant milestone in 3D reconstruction and broadening its applications.
Authors
This article was written by Valentine Bellet, Dimitri Lallement, David Youssefi, Dawa Derksen and Erwin Bergsma, from the ID, TPA and LOT services within the Data Campus department (Technical and digital direction).