Sentinel-2 optical images, with their five-day revisits, 10-meter resolution and numerous optical spectral bands, enable us to estimate the characteristics of vegetation cover (green leaf area per square meter (LAI), chlorophyll content, leaf orientation, etc.), and monitor their changes. To extract this information, we are increasingly using neural networks, which learn to determine these characteristics from reference datasets. This article presents the methods classically used for this application, followed by a new method proposed by Yoël Zérah during his PhD at CESBIO, supervised by Jordi Inglada (CNES) and Silvia Valero (IRD).
Regression from in-situ data.
15 years ago, the machine learning estimates of these variables were obtained using information collected in the field almost at the same time as the satellite observation. But collecting this information is time-consuming and costly. Neural networks (NN) have many parameters, and deep neural networks have even more. A robust learning requires more than one observation per parameter to be determined. The use of field data to train NN therefore requires a very simple model, and the result can be inaccurate if the phenomenon to be modeled is complex.

Reference data generated by physical simulators
Over the last few decades, methods for generating reference data using models have emerged. Instead of collecting data in the field, a physical simulator is used to generate the data. One example is the PROSAIL model, which models vegetation as a gas of leaves. This model is fast, and the cost of generating training data is low.
When teached with realistic data, the simulator can be more accurate and simple: there's no point in teaching it cases that never occur. However, a great deal of detail is needed to distinguish between different but similar cases. To prepare the training datasets, we need to find the ranges of variation and covariance of the various model parameters. Our colleague Marie Weiss (INRAE) has devoted several years of research to this task, developing the BV-NNET model, used in ESA's SNAP software, or in the biophysical variable products soon to be distributed by THEIA.

A new PROSAIL model inversion method
During his thesis at CESBIO, supervised by Jordi Inglada (CNES) and Silvia Valero (IRD), Yoel Zérah developed a new method for inverting the PROSAIL model. It involves swapping the two boxes in the previous diagram: the regression model and the physical model (in reality, it is a bit more complex). A neural network uses Sentinel-2 data to determine intermediate variables which are used as inputs to the PROSAIL model. The network parameters are optimized to minimize the differences between the input S2 data and those simulated by PROSAIL. The intermediate variables obtained at the output of the neural network are therefore the vegetation characteristics we're looking for, and the data used in training are realistic in nature, since they are real data. This method therefore saves the training set development phase. The method is described in greater detail in this article on the CESBIO blog.

Validation results
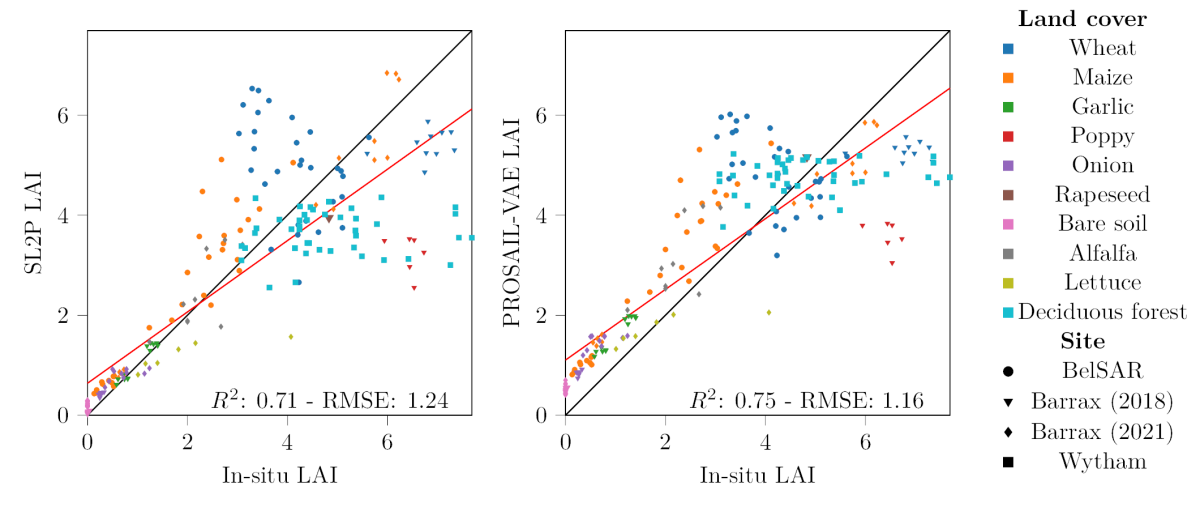
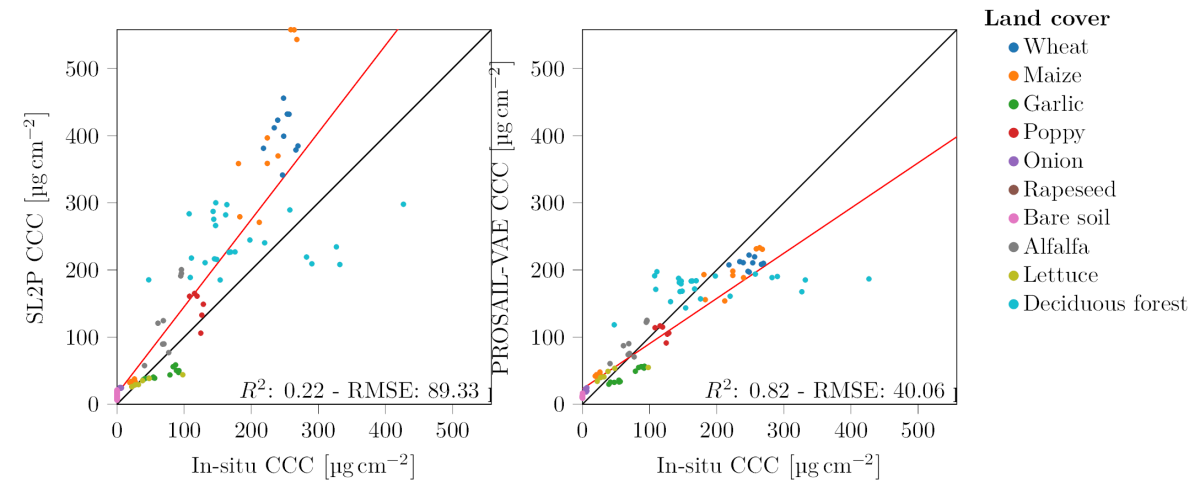
The plots below show the results obtained on a large number of in-situ data acquired on different crops. For leaf area index, the results are equivalent to those of the BV-NNET model (with a small bias on bare soil for the new model). For chlorophyll estimation, the results are much better than those of BV-NNET. The network has the advantage of providing all the input variables for the PROSAIL model, but unfortunately there is little in-situ data available to validate its performance. It also provides an estimate of the accuracy of the results and can be used to generate histograms of the covariance between variables in this model.
Conclusion
In conclusion, in less than a year, this work has produced results very close to the state of the art for LAI estimation, and even better for chlorophyll content. Its huge advantage lies in the fact that, since it is trained on real observations, the variable distributions are realistic by construction. However, this method requires that the physical model used be derivable to enable gradients to be calculated. It is the case for PROSAIL.
This deliberately simplified article was written by Olivier Hagolle, based on an article by Yoel Zerah on the CESBIO blog, and diagrams provided by Jordi Inglada.
