It’s been said we know more about the surface of the Moon than the bottom of the oceans. And it’s true that barely a quarter of the ocean floor has been surveyed by shipborne sonar, the most precise method of measuring water depth and seafloor topography.
These measurements have been complemented by calculations based on sea surface topography data from altimetry satellites like Sentinel-6 Michael Freilich and equivalent missions. But these data were acquired directly beneath the satellite and detection and computation were made more complicated where seafloor topography is steeply sloping.
While a satellite’s instruments can’t actually “see” under water—at least no more than a few metres in clear water in certain cases (like SPOT/Pleiades, Sentinel-2 or IceSat-2)—the sea surface topography partly mirrors the seafloor relief.
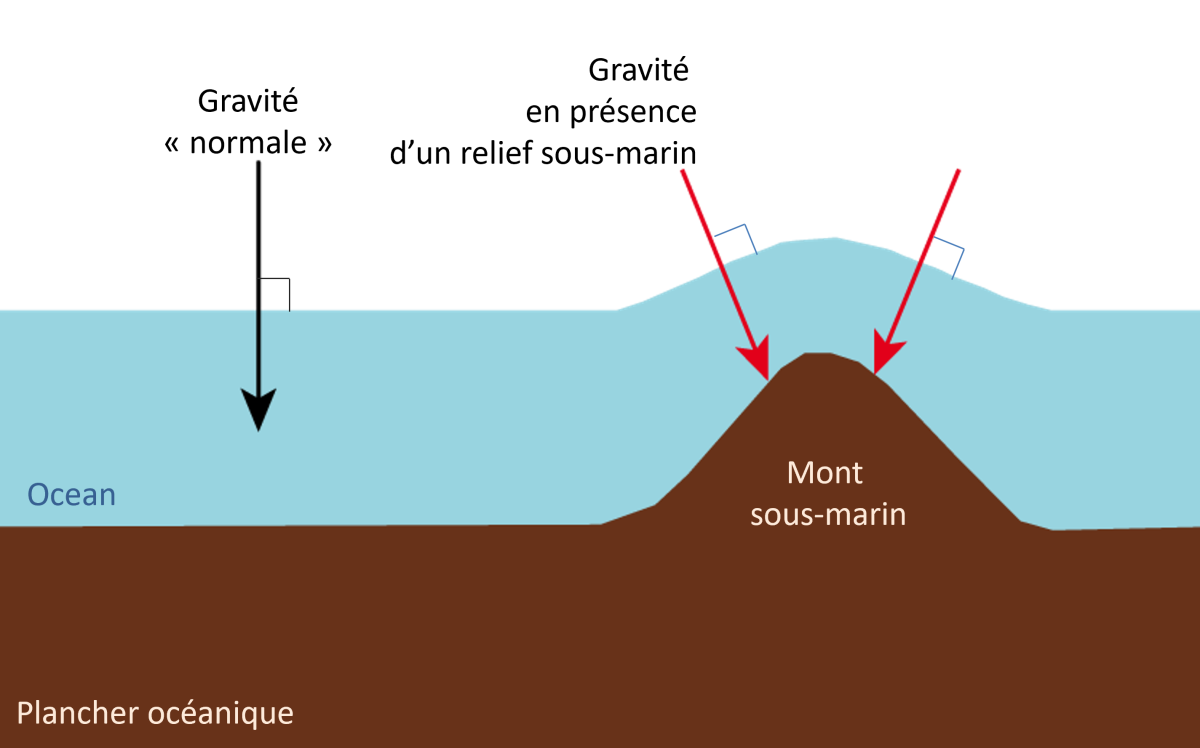
We can therefore deduce the seafloor topography from this sea surface topography. The KaRIn instrument aboard the French-U.S. SWOT satellite developed jointly by CNES and NASA measures this sea surface topography at high resolution with very good accuracy across a 120-kilometre swath, unlike previous altimetry satellites.

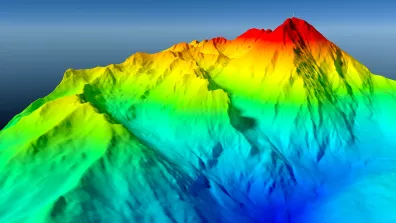
The red patches on this map covering 500 kilometres by 1,000 kilometres west of the coast of Peru in the Pacific Ocean are seamounts. This image was obtained by processing sea surface topography data from SWOT, which mirror the seafloor relief. For example, the two seamounts indicated by arrows rise to about 1,000 metres and were previously unknown.
SWOT will thus enable us to find thousands more seamounts still to be discovered.
Today, we know of some 44,000 seamounts rising 1,000 metres above the ocean floor. Based on one year of SWOT data, a team at the Scripps Institution of Oceanography estimates this number could be more than doubled, and possibly to as many as 100,000 with future data. Other seafloor features like complex structures around ocean ridges and flow channels in the continental shelf also remain to be discovered.
Deeper knowledge of seafloor topography should ultimately facilitate submarine exploration and even make the high seas safer for shipping. It could also enable future eruptions to be located and predicted more accurately, through a closer understanding of tectonic plate motions.
Charting seafloor topography also tells us more about ocean circulation, as submarine mountain chains can affect currents, causing them to plunge deeper. Learning more about this mechanism is crucial to better characterize the role of the oceans in climate disruptions.
More data acquired in the years ahead will help to chart seafloor topography in even finer detail. However, shipborne surveys will remain vital in determining exactly how the sea surface and seafloor are related.
Shipborne data, combined with satellite data and methods based on artificial intelligence, will considerably improve our understanding of the seafloor, especially in oceans far from land where in-situ measurements are scarce.
Oceanography data from the SWOT mission can be accessed via the AVISO platform and hydrology data at hydroweb.next.