

El Niño, the ocean phenomenon that generates marine heatwaves impacting Earth’s climate, is making a comeback this year along the coasts of Peru and Ecuador. And climatologists believe it could be an especially intense episode. How do they know? Largely from interpreting data acquired by oceanography satellites, which give us insight into the state of the world’s oceans and reveal the early signs of the event building up. But the phenomenon is notoriously full of surprises and this one could equally well turn out weaker than expected.
El Niño is the result of a feedback cycle fuelled by a slackening of tradewinds that normally push warmer water towards Asia, and by warmer surface waters in the eastern Pacific around the equator, which in turn further weaken the tradewinds. As a direct consequence of this, upwelling of nutrient-rich cold water is shut off and the shoals of fish normally present in coastal waters disappear, so El Niño is not just a regional issue. While it certainly has a huge effect on the region’s fishing fleets, this warming of the ocean several degrees above normal seasonal temperatures affects mean conditions all over the globe.


What are the effects of an El Niño?
In Southeast Asia, one of the results of an El Niño is reduced monsoon rains vital to agriculture, pushing up food prices and increasing fire risks.
In East Africa, North America and southern nations in South America, the phenomenon can have the opposite effect, with torrential rains raising the risk of flooding. In Amazonia, however, climate shifts bring severe drought, while in Australia rising temperatures endanger corals, which are very sensitive to warmer waters.
To support preparedness for severe weather events that can have serious effects on people, the environment and the world’s economies, governments rely on seasonal forecasts from operational forecasting agencies that input observations into their models to predict the intensity of an expected El Niño several months ahead. Such events usually peak towards November or December of the current year.
Hard to predict
But despite our best efforts, forecasting extreme events remains very hard, notably due to models’ limited ability to accurately represent ocean-atmosphere interactions in the eastern part of the equatorial Pacific. This region of the globe is instrumental in amplifying El Niño episodes.
When the sea surface temperature crosses a threshold of around 28°C, deep atmospheric convection strengthens significantly. The resulting upward air movements promote the development of strong westerly surface winds, which in turn amplify warm sea surface temperature anomalies. This positive feedback loop, known as the Bjerknes feedback, can spiral out of control and lead to extreme events, sometimes referred to as “super El Niños”, as was the case with the 1997 event.
To anticipate such events, climate experts are working on models that aim to predict how they will evolve based on the laws of physics. These models ingest a range of atmospheric and oceanographic data like salinity, sea surface temperature and height at different times, or wind temperature and direction.
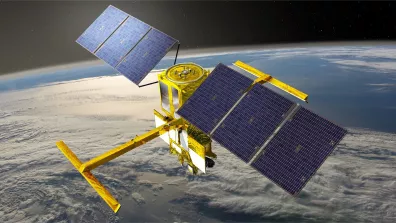
Data from the Jason-3 (NASA/CNES) and Sentinel-6 (ESA/NASA) missions, and more recently the SWOT (NASA/CNES) mission are crucial in this respect, revealing the heat content of the upper layers of the ocean, which have a key bearing on our ability to predict the system of ocean-atmosphere interactions in the tropics. These data also provide global coverage, complementing in-situ data from drifting buoys and oceanographic vessels.

A clue in sea level variations
How do we measure sea surface height? The instruments flying aboard altimetry satellites bounce a radar signal off the sea surface and record how long it takes to return, thus enabling the distance (or range) to be calculated. This value is then correlated to the satellite’s exact position with respect to Earth’s geoid—i.e., its surface shaped only by gravity—to deduce the sea surface height with respect to a mean level (figure 2a). By filling in the data gaps between measurement points we can thus obtain sea surface heights all around the globe to reveal a positive El Niño anomaly (figure 2b).
Satellite altimetry plays a crucial role in detecting the first early-warning signs of such events. Sea level along the equator is very sensitive to westerly gusts, which disrupt tradewinds and generate planet-wide ocean waves, propagating sea level anomalies across the Pacific basin in a matter of months.

Another vexing scientific question concerns our understanding of how an El Niño interacts with recurring sea level anomalies observed along the west coast of South America, commonly referred to as “coastal El Niños”. This is one of the objectives of the OSTST-CENDA (Coastal El Niño Dynamic from Altimetry) project, funded by CNES, which aims to gain a better understanding of the dynamics of these coastal events by combining altimetry data with ocean models of varying complexity.
To this end, CENDA is drawing on 30 years of altimetry data from the TOPEX/Poseidon and Jason 1, 2 and 3 missions. Combined with ocean simulations generated by fresh analysis of data records, these data notably reveal the vertical structure of ocean disturbances, a key element in understanding propagation mechanisms and how they affect regional circulation.
Ultimately, this research will enable the coastal dynamics of El Niño events to be modelled more precisely to make global forecasting of the phenomenon more reliable, paving the way for an operational El Niño forecasting system for affected nations along the west coast of South America.
IASI tracking temperature anomalies
El Niño 2026 is coming and the IASI atmospheric sounding instrument is precisely tracking surface temperatures, especially sea surface temperature (SST) anomalies in the Niño 3.4 region (a rectangle in the Pacific at 5°N–5°S, 170°W–120°W), the international reference for monitoring El Niño and La Niña episodes.