How altimetry works

Observation of the oceans most certainly began when the first mariners set out to sea. To begin with, observations would have been concerned with finding the best trade routes. Subsequently, as each new discovery by explorers raised new questions, the study of the oceans developed into a scientific discipline.
Data collected in situ over the centuries formed the foundation for modern oceanography by revealing the complex nature of ocean phenomena and helping to invent new measuring instruments.
Space technologies are a good example. Among the many instruments sent aloft on satellites, altimeters have changed our perspective of the oceans forever.
Satellite altimetry measurements of altitude can today gather more data about ocean circulation in 10 days than ships collected over several centuries.
Did you know?
Earth – a misleading nameA few figures about the oceans below give some idea why "Ocean" would be a more appropriate name for our planet:
- Total ocean surface area: 360 million km2, covering 71% of the planet (700 times the area of France)
- Total mass: 1.4 billion billion tonnesMean depth: 3,800 m (11,000 m at deepest point)
- Mean depth: 3,800 m (11,000 m at deepest point)
- Temperature: –4°C in polar regions to +30°C in tropical regions
- Age : 4.5 billion years
- Current flow velocity: 1 mm/s to 1 m/s.
Charting ocean currents
Mariners have studied ocean currents to find the best routes since ancient times. Benjamin Franklin was the first to chart the Gulf Stream in 1777, by measuring sea temperatures. He recommended following this warmer current to reduce trip times between New York and London.
In 1849, Matthew Maury published the first global charts of winds and currents compiled from data collected by ships. Exploration of the oceans for purely scientific purposes really began in 1872, when the first Challenger expedition surveyed the oceans for 42 months, gathering data from the surface to the sea floor.

En 1849, Matthew Maury publie les premières cartes mondiales des vents et des courants à partir de données recueillies par bateaux. L'exploration des océans à vocation purement scientifique commence réellement en 1872, lorsque l'expédition Challenger arpente les océans pendant 42 mois et collecte des données de la surface jusqu'au fond.
From the 1970s, space technologies revolutionized the way scientists study the planet. The technique of satellite altimetry was first presented at a symposium in Athens in 1965 and subsequently used on the U.S. satellites GEOS 3 (1975), SEASAT (1978) and GEOSAT (1985). The first large-scale altimetry mission was the French-U.S. satellite TOPEX/POSEIDON (1992), followed by JASON-1 (2001) and ENVISAT (2002).

These missions have taken ocean science to new heights. Now, scientists can study the planet from a global perspective in which Earth is a unique system of elements—land masses, oceans, atmosphere and biosphere—that are constantly interacting.
With satellites, they also have the capability to monitor natural phenomena in real time through repeat observations of the same point at regular intervals of only a few days.
Did you know?
Currents keep Europe warm
The Gulf Stream is a warm current flowing from the Caribbean to Europe. Its temperature varies from 18°C to 28°C, and the volume of water it discharges can reach 100 times that of all the rivers of the world put together. It also warms the air in Europe. Indeed, without it winters in Western Europe would be as cold as in Quebec.
Altimetry theory
Altimetry measurements are acquired by an altimeter on a non-synchronous satellite in a repeating low-Earth orbit designed to fly over the same points at regular intervals.
The altimeter is a radar instrument that emits a signal at very high frequency—typically 2,000 pulses per second—vertically beneath the satellite. This signal propagates until it meets an obstacle, which reflects a radar “echo” back to the altimeter's antenna.

By calculating the round-trip time of the signal, we can determine the distance—or range—from the obstacle (in this case, the ocean surface) to the satellite. This calculation is performed simply by multiplying the time by the speed of light at which electromagnetic waves propagate (see panel).
Formula
v = d/t
où d est la distance (en km) et t le temps de parcours (en s).
Donc :
d = v.t
Dans notre cas, la vitesse v est égale à la vitesse de la lumière
c = 300 000 km/s
One major drawback of ocean-observing altimeters is that radio waves cannot penetrate below the sea surface. Consequently, we have to estimate the sea-surface height with respect to an arbitrary terrestrial reference surface.
In practice, to achieve the required level of accuracy, this theoretical measurement is corrected for perturbations of the satellite on its orbit and propagation of radio waves as they pass through the atmosphere.
Main altimetry missions currently in operations
| Satellites | Origin | Altitude | Exact revisit interval* | Ground track separation between two passes ** |
| ERS-1 (1991), ERS-2 (1995), ENVISAT (2002) | Europe | 800 km | 35 jours | 80 km |
| TOPEX/POSEIDON (1992), JASON-1 (2001) | France/Etats-Unis | 1 330 km | 10 jours | 315 km |
| GFO (1998) | Etats-Unis | 880 km | 17 jours |
The orbit of an altimetry satellite is a compromise: the shorter the orbital period, and therefore the revisit interval, the narrower the coverage area.
* The exact revisit interval corresponds to the time it takes the satellite to complete a full cycle and pass exactly above the same point.
** The ground track separation corresponds to the distance at the equator between two consecutive passes over the same area.
Altitude and sea-surface height
Since the altimeter only measures the range from the satellite to the sea surface, called R, we have to calculate the sea-surface height with respect to a terrestrial reference (see diagram).
To do this, we must first define an arbitrary reference surface. Since the sea depth is not known accurately everywhere, we use a regular, imaginary surface that is a raw approximation of the shape of the Earth, which is a sphere flattened at the poles. This surface is called the reference ellipsoid, which allows us to calibrate data precisely and uniformly.
The satellite's altitude with respect to the reference ellipsoid, called S, is calculated with an accuracy of 3 cm using the satellite's orbital parameters and precise positioning instruments.
The sea-surface height is thus the difference between the satellite's altitude relative to the reference ellipsoid and the altimeter range, in other words S-R.

This height corresponds to the undisturbed sea level, called the geoid, and the ocean circulation or dynamic topography, which is the consequence of the Earth’s rotation, winds and tides.
Did you know?
A glassy sea… of ridges and valleys
The ocean surface is constantly moving. Why? The answer is the Sun. Because the Earth’s axis of rotation is tilted, the Sun’s heat is not felt equally everywhere. Natural circulation of heat between the atmosphere and oceans, driven by currents and winds, smoothes out any imbalances.
Correcting to improve accuracy
Radio waves transmitted and received by an altimeter do not travel in a vacuum.
Signals passing through Earth's atmosphere may be subjected to path delays, thus introducing errors into measurements. For example, large amounts of electrons at altitudes near 400 km, dry air and water vapour all generate errors ranging from a few centimetres to more than 2 metres.
To achieve the extreme level of accuracy required, we have to identify the source of these perturbations and then calculate the necessary corrections. Special instruments on board the satellite are designed to measure physical parameters for this purpose. After corrections, the satellite-to-ocean range can be estimated with an accuracy of 2 centimetres.
Since the aim is to estimate sea level precisely with respect to a terrestrial reference, measurements must also be independent of the satellite. For this reason, we need to know the satellite's exact orbital position.
This is the role of the onboard orbit determination systems, supported by a network of ground location beacons and orbital trajectory models. Used in combination with GPS positioning instruments, these systems enable us to calculate the satellite's position very precisely relative to Earth, in terms of its altitude, longitude, latitude and orientation.

A treasure trove of information

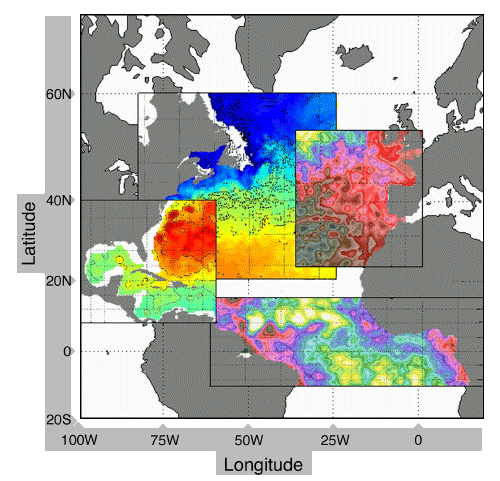
Satellite altimetry is used to acquire sea-surface height measurements that yield information about:
The satellite gathers data on any point of the ocean surface.
But measurements also contain a treasure trove of information about the entire water column, from the surface to the sea floor, including current speed and direction, wave heights and wind speed.
Oceanographers use these data to chart currents, study ocean seasons, improve knowledge of tides, monitor mean sea level and detect climate anomalies such as .
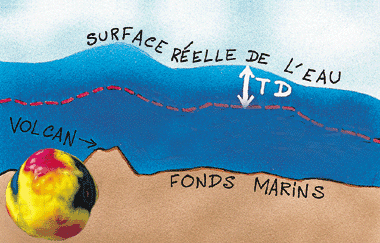
The ocean floor:
The topography of the ocean surface mirrors the bottom topography, albeit in attenuated form. A bump in the surface may correspond to a volcano or sea-mount, which creates a pocket of higher gravity that in turn leads to a build-up of a deeper layer of water.
Altimetry therefore allows us, indirectly, to obtain a picture of the geoid and is also useful in geophysics and geodesy for studying the physical properties of the solid Earth.